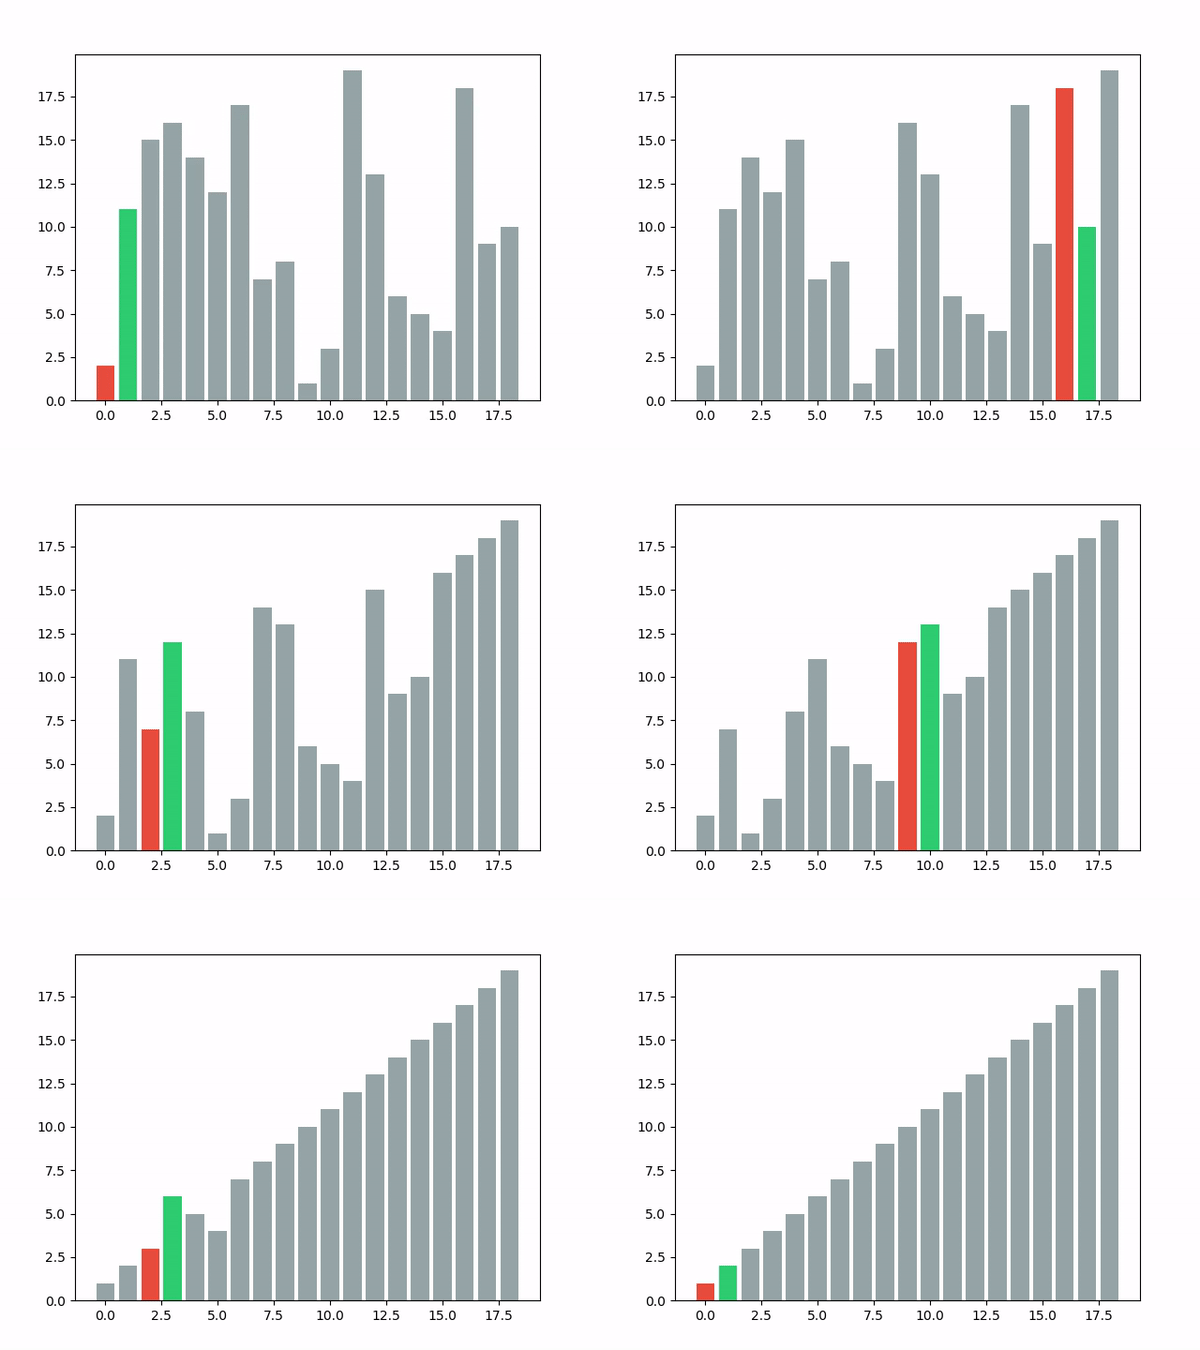
闲着没事,做了一个冒泡排序的可视化小程序,新人一枚,做的不好,还请各位大神轻拍。
排序简单,主要是如何将排序的过程动图表示出来,用到了matplotlib的pyplot和animation模块。
在matplotlib作图中,比较常用的是matplotlib.pyplot模块,这个模块有非常多的属性和方法,简要列举下这次用到的方法:
matplotlib.pyplot.subplots(nrows=1, ncols=1, sharex=False, sharey=False, squeeze=True, subplot_kw=None, gridspec_kw=None, **fig_kw)
返回
- fig :
matplotlib.figure.Figureobject - ax : Axes object or array of Axes objects.
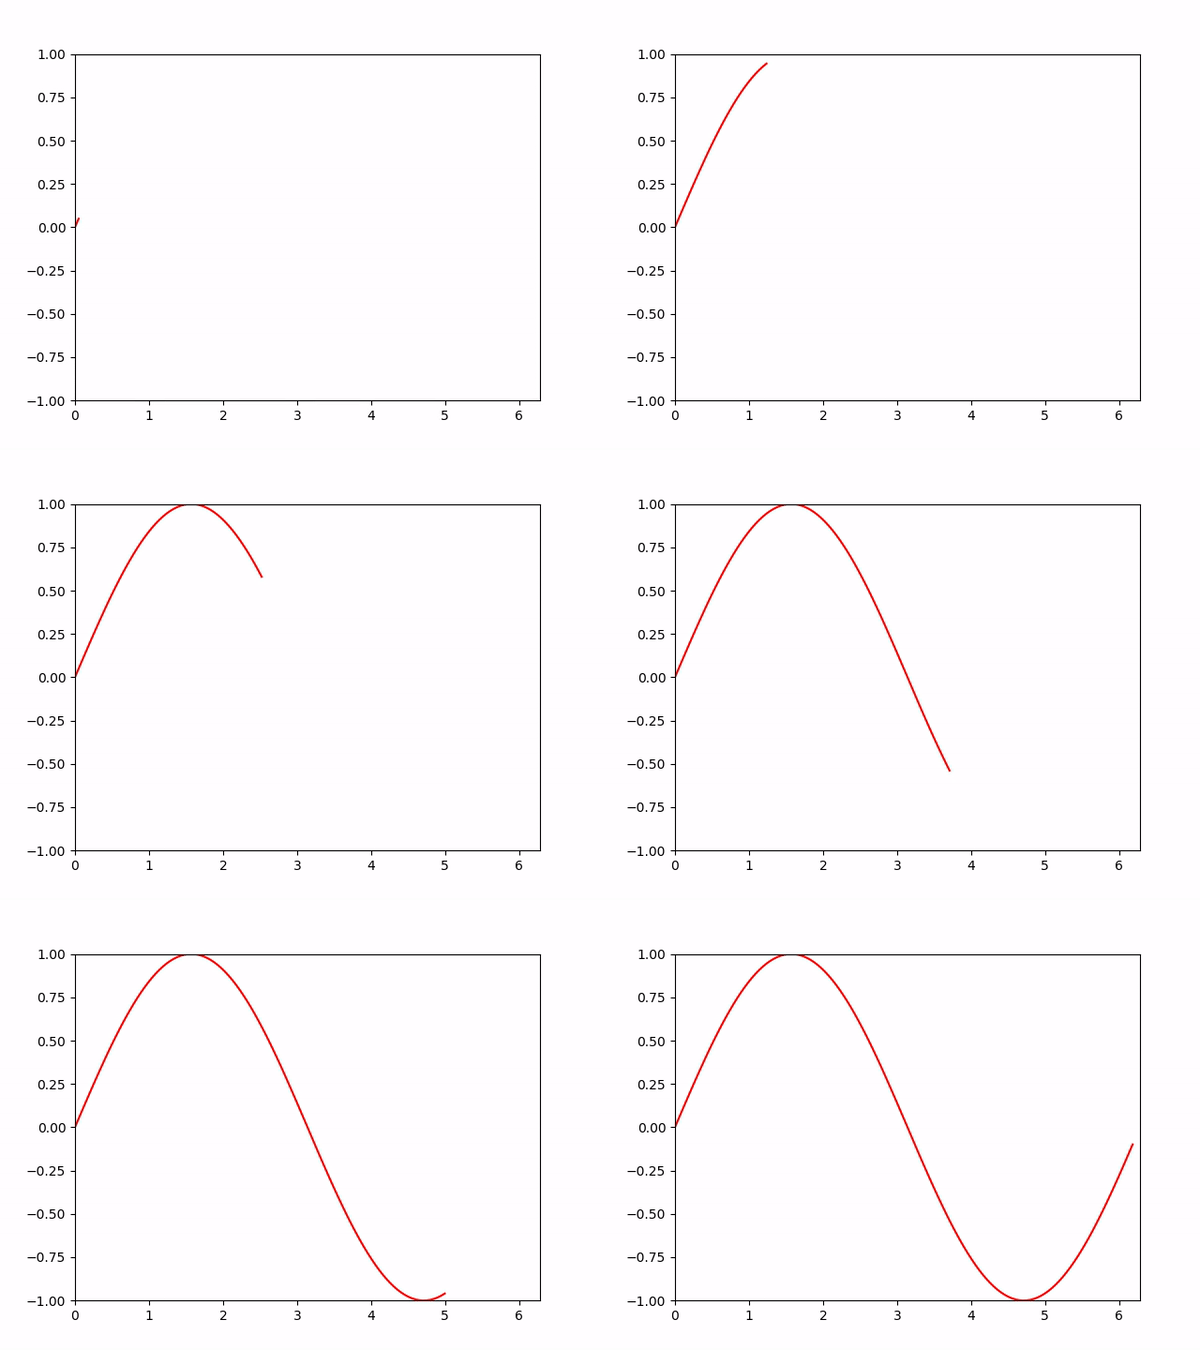
先举个例子:
1 | import numpy as np |

先看一下animation.FuncAnimation:
1 | class matplotlib.animation.FuncAnimation(fig, func, frames=None, init_func=None, fargs=None, save_count=None, **kwargs) |
其实就是搭建一个动画的骨架,
- fig : matplotlib.figure.Figure ,就是画图的框子
- func : callable ,就是每一帧需要更新函数,需返回
plt.plot或者其它形式的画图对象 - frames : iterable, int, generator function, or None, optional ,就是一个可迭代对象,每一次为传给
func去生产当前帧
其它就不说了,参照文档理解。
所以动画的过程就是:
- 先把需要生产动画的骨架搭好,比如所需的数据,需要画图的函数,更新的函数对象等等
FuncAnimation方法主要是与update函数做交互,将frames参数对应的数据逐条传进update函数,再由update函数返回的图形覆盖FuncAnimation原先的图形,interval为每次更新的时间间隔,还有其他一些参数如blit=True控制图形精细,当界面较多子图时,为True可以使得看起来不会太卡,关键是frames参数 。plt.show()显示出来
所以对于排序过程可视化大概可分为:
- 对排序数组进行排序,记录每次循环迭代的相对位置,并将其存储
- 为了观看直观,对于当前比较对象和其它对象设置不同的颜色,并与当前数组打包
- 将所有生产的状态数组(每组包含颜色信息)传递给
FuncAnimation,update将数据解包,得到画柱状图的height和color,update返回plt.bar,生成当前帧 - 显示或存储动图

1 |
|
代码放这:
https://github.com/xqitong/bubblesort_vi
参考链接:
https://blog.csdn.net/sailist/article/details/79502007#输出mp4格式的视频